ADA/BTC/BINANCEADA/BTC/BINANCE
BUY : 0.00004500 - 0.00006100
TARGET 1 : 0.00005 - 0.000064
TARGET 2 : 0.00007000 - 0.00008000
TARGET 3 : 0.00008500 - 0.00009
TARGET 4 : +0.00010000
STOP LOSS : LESS 0.000039
Search in ideas for "ada btc"


ADA/BTC: Upwards Correction before rocketing The current ADA/BTC is sitting at 7th place by market capitalization, around $8.3 billions.
After ADA having a nice bullish run since early April, around 2000 satoshi, ADA/ hits a resistance zone around the 4000-4200 satoshi area.
As the alts remain coupled towards BTC/USD momentum and has yet to decouple from it, ADA/BTC follows suits the general downtrend of BTC where BTC seems to be confused as of now where it has yet to find solid support and momentum for its next run.
The momentum of ADA has weaken and ADA reaching overbought zone in the RSI indicator in the 4hr chart. In the daily chart, ADA remains neutral amist the confusion in the general market has been tanking.
From fib analysis, we can see the recent higher high made around 4200 satoshi around early May has reached the 0.618 fib of all time high of 8900 satoshi. ADA tested the 0.618 fib and lost momentum and start reversing to the first support level around 3200 satoshi. The SMA-50 (3351) and SMA-100 (3474) both trading above the ADA/BTC while SMA-200 provides a solid support around 3254 satoshi. The ADA is getting close to SMA-200 value and should find solid support at the region there. The SMA-200 also confirms the fib's level support of 0.618 around the 32xx satoshi areas.
From the Bollinger band analysis, ADA remains to be trading in the lower side of the band and assumes continuation of downtrend until reaching the first support area of 3200 satoshi. More confirmation on volume and momentum needed before the bollinger getting into a squeeze and shows sign of expansion. The squeeze is starting to form as ADA heading towards the support zone. Seeing the RSI indicator is reaching an oversold zone at 33 in 4hr chart and remains neutral in the daily chart. This indicates the ADA will be floating around the 3300 range for awhile.
Possible scenario:
1. Head towards 3200 satoshi and find support while BTC maintaining its support around 8.5k. If bollinger starts to squeeze as volume builds up, ADA will shows sign of reversal to test the next resistance zone at 5200 satoshi range.
2. If BTC fails to hold its steady position, ADA is most likely to follow the trend and assumes downwards, possibly testing the next support zone at 2500 satoshi.
However, with BTC/USD staying in the range of 8-8.5k, ADA has a good chance to test its first support and gain its momentum and head towards the next target.
Buy Zone: 3300-3400
Target Profit: 5100-5200 (60%)
Now's the time to accumulate some reasonable price ADA. Price trading close to SMA-200 and still variance below SMA-50 & 100 (undervalued). ADA also remains at the lower band of bollinger bands and buy-in entry can be confirm when it reverse towards the middle line to assume upwards trend between band.
*Disclaimer
This is not a financial advice. Please conduct own due diligence before trading.
I am learning and I wish to trade ideas and debate and improve with the community. I will work harder on my presentation writings to present my ideas better so the readers can have a better technical picture of the crypto.

ADA/BTC & ADA/ETH=bullish signal!!!In these chart, I want to discuss Cardano/Bitcoin ratio & Cardano/Ethereum ratio. They're bullish. That mean that Cardano it's takeover power in front of Bitcoin and Ethereum.
1. ADA/BTC:
Cardano it's look extremely bullish in front of Bitcoin. We see a bullish rising wedge and my next forecast it's that Cardano it's leading to reach 0.000068 BTC. Now, this it's an example: If you hold 1,000 ADA, So, and if you want to get profit in Bitcoin ratio, your profit will be 0.068 BTC. It's nice if you hold Cardano. In my case, I hold 14,414 ADA, If I decide to sell my 14,414 ADA in Bitcoin, my profit in Bitcoin ratio will be 0.98 BTC. This it's so incredible and 0.98 BTC it's so near of 1 BTC in my profit. Incredible!!!
2. ADA/ETH:
cARDANO It's look bullish too in front of Ethereum. We see a simetric triangle and my next forecast it's that Cardano it's leading to reach 0.0013 ETH. Now, this it's an example: If yo hold 2,000 ADA, So, and if you want to get profit in Ethereum ratio, your profit will be 2.60 ETH. It's very nice if you hold Cardano and if you planning in Ethereum. In my case, as I hold 14,414 ADA. If I decide to sell my 14,414 ADA in Ethereum, my profit in Ethereum ratio will be 18.73 ETH. So, 18.73 ETH it's incredible holding Ethereum too. And also, applying the reversal strategy of ETH/BTC or knowed like Ethereum/Bitcoin ratio. You can to use your 18.73 ETH and hold until reach like 0.14 BTC for each 1 Ethereum that you accumulating. For example: If I planning to sell my 18.73 ETH in Bitcoin at 0.14 BTC. So, my profit in Bitcoin will be 2.62 BTC. So 2.62 Bitcoin it's really brilliant.
So guys, this it's very educative content that it's support you a lot. Also, I'm accumulating Cardano coins in my trading app that I use and one of my goal it's to reach a minimum 17,000 ADA, This it's my next up plan to accumulate Cardano during this rally until I decide when to sell Cardano in front of ratios that I know. Right now, my worth in Cardano in Bitcoin it's around of 0.66 BTC coins and in Ethereum it's around of 9.51 ETH coins

ADA/BTC hit targets now retrace watching: Cardano support zonesQuick plot to observe possible support zones for Cardano.
This is part of ongoing analysis of ADA vs BTC as linked below.
In general I am quite bullish on this coin versus most Alts.
1600 retest seem very likely soon.
1590 could be a stop hunt below 1600.
1575/55 must hold to continue uptrend.
My ADA journey this year:
Spotted the likely breakout:
Measuring the continuation:
Spotting an intermediate TOP:
Plotting the correction from that top:

ADA/BTC Higher Lows | Critical Resistance | Triple BottomHello Traders!
Today’s chart update will be on ADA/BTC which has been putting in consecutive higher lows as it comes to test a critical resistance level. Will ADA have enough momentum to break this level and maintain a bullish bias?
Points to consider,
- Overall trend changing
- Support respected with a triple bottom
- Resistance currently being tested
- Stochastics neutral, projected upwards
- RSI neutral, not overbought
- Bollinger bands tightening
- VPVR decreasing in volume of transactions
ADA has changed it’s mid- term trend from its overall bearish sentiment, a full trend change confirmation will only come to fruition when the critical resistance level is broken. Support has been respected; a triple bottom is evident, signalling that buyers are strong in that area. Resistance is being tested as of now, has rejected price multiple times, however this time price is consolidation near resistance, signalling a break looks imminent.
The stochastics is neutral at current time; momentum in either direction will dictate the bullish and or bearish bias. RSI is also neutral, respecting its trend line as it approaches its apex.
The Bollinger bands are tightening as ADA reverts back to the mean; this signals that a break will be imminent. The VPVR is clearly decreasing in volume of transactions; bulls have low resistance poised in the cluster above.
Overall, in my opinion, ADA/BTC will confirm its trend change by breaking current resistance convincingly. This will allow the trend to put in a new higher low. A rejection from current point will send ADA back to support, which will probably confirm a trading range.
What are your thoughts on ADA/BTC?
Please leave a like and comment,
And remember,
“If you don’t respect risk, eventually they’ll carry you out.” – Larry Hite

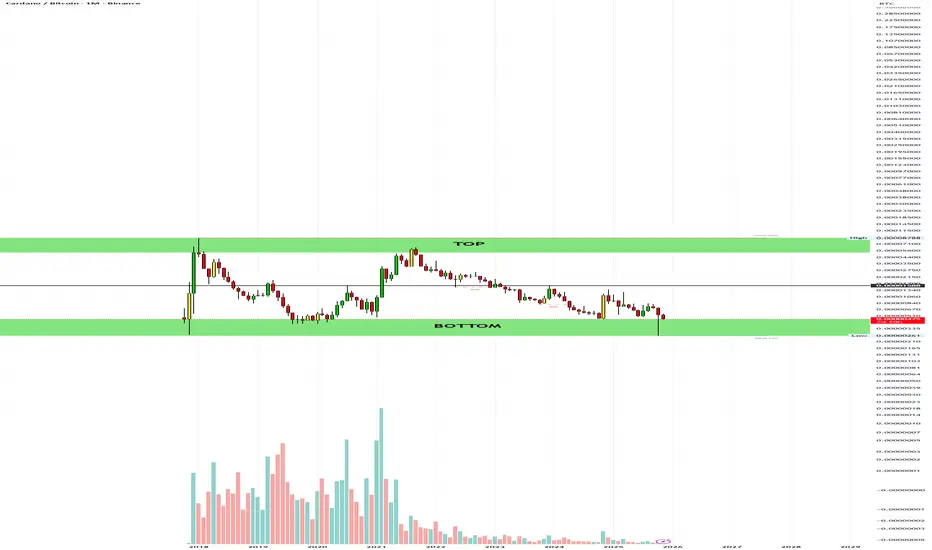
ADA/BTC Macro Analysis – Altseason SetupThe ADA/BTC pair continues to trade within a well-defined macro range that has held for several years, with price now sitting directly on a major historical demand zone.
BOTTOM Zone (Historical Demand):
Price is currently testing the same bottom range that has triggered multiple strong reversals in past cycles.
Historically, this zone has been one of the best long-term accumulation areas for ADA relative to BTC.
TOP Zone (Macro Resistance / Target):
The upper green zone represents the primary macro resistance and the previous ATH for ADA/BTC.
In every prior cycle, price rallied from the Bottom zone all the way to this Top zone before forming a new correction.
Current Trend:
The overall monthly trend remains bearish, but ADA has reached a critical point where macro reversals typically begin especially when approaching an Altseason phase.
Potential Targets:
First target: Mid-range level
Macro target: Full retest of the TOP zone (ATH range)
Conclusion:
ADA/BTC is sitting on one of its strongest historical accumulation zones.
If the pair repeats its previous cycle behavior, a major upward move toward the TOP zone remains highly probable during the next altcoin season.
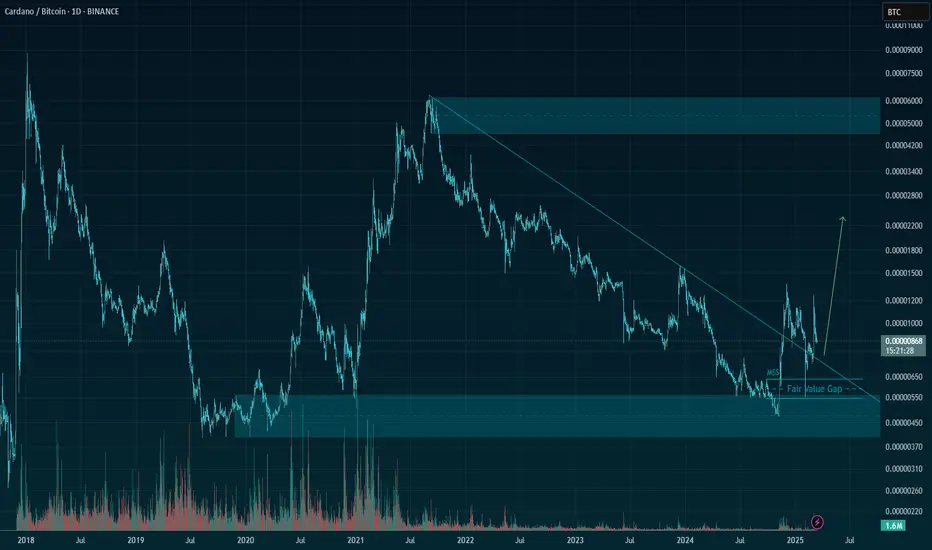
ADA/BTC Technical Analysis: Bullish MomentumThe ADA/BTC pair is currently navigating a critical point in its price action. With ADA's fundamental progress in the Cardano ecosystem and its strong focus on decentralized finance (DeFi), many traders are keeping a close eye on its performance against Bitcoin. Despite the recent volatility in the broader crypto market, ADA has shown resilience and potential for growth.
Market sentiment remains cautiously optimistic, with ADA building a solid foundation in the DeFi space and Bitcoin continuing to hold strong as the market leader. Technically, we’re seeing key support and resistance zones forming, and this analysis will highlight possible breakout or reversal scenarios. Keep an eye on volume trends and any developments around Cardano’s network upgrades, which may fuel further price movements.
ADA has a great future based on the chart (ADA/BTC). Take a deep look at it.
ADA/BTC has started its move!!!GUYS, im excited to share this with you! This is a falling wedge on the daily timeframe of ADA/BTC and we are on the verge of breaking it this time. Whether we break it today or get rejected today, there is one thing thats guaranteed and its that the breakout is inevitable. a breakdown should be impossible as it would mean that ada/btc would drop to like 0.00001 and below. People that call ada trash might probably say it IS going 0.00001 but i dont see it possible. The more hate ada gets the more bullish that is. The breakout target of the falling wedge is 0.00003. ADA TO THE MOON

ADA/BTC gets boost from news: Cardano Targets to look forADA had some news of progress and price is moving.
It is now in 'Buy-the-Dip' mode for any fans of this coin.
Watch the resistance zones above for pullbacks to come.
500-504 sats is key support that must NOT be broken.
568-572 sats is the likely target for this current wave.
600-604 sats would be the extended Ultra-Bull target.
.
See some of my other plots and trade calls below.
I also plot Forex and Stocks, take a look at my profile page .
Currently in Play:
LTC bottom at $65?
RVN temp top 415
Alt Extinction Event?
Recent Achievements:
ADA breakout (PERFECT targets, massive profits)
BTC to 14k call (Near Perfect target, easy trade)
BTC bottom 3.1k (caught the EXACT bottom)
LINK re-entry (caught the spike)
LTC to $150 call (near perfect plot)
MATIC top Warning (caught the EXACT top)
NEO Rocket Launch (great entry, massive profits)
ETH breakout (instant Profits, no drawdown)
MATIC rocket (massive Profits, breakout entry)
ZRX breakout (massive Profits, short wait)
XLM breakout (massive Profits, instant Win)
FET top warning (EXACTLY on time)
DASH top warning (EXACTLY on time)
Of course, I have had total FAILS on some ideas too, not going to pretend.
But all of my plots show PRECISE entries, TIGHT stops, and EXACT targets.
Precision is the way of the Fib. Almost every turn happens at a Fib Line.
.

ADA/BTC may have bottomed, ready for Breakout: Cardano 27% gain?ADA has been clobbered vs BTC like almost all Alts.
Fibs indicate possible bottoming process completed.
It currently at a key resistance zone worth watching.
There are several Fibs in play, all from the drop.
The various time frame charts allow closer views.
Clusters are most important landmarks to obverse.
.
See some of my other plots and trade calls below.
I also plot Forex and Stocks, take a look at my profile page .
BTC to 14k call
BTC bottom 3.1k (caught the EXACT bottom)
LINK re-entry (caught the spike)
LTC to $150 call (near perfect plot)
MATIC top Warning (caught the EXACT top)
NEO Rocket Launch (great entry, massive profits)
ETH breakout (instant Profits, no drawdown)
MATIC rocket (massive Profits, breakout entry)
ZRX breakout (massive Profits, short wait)
XLM breakout (massive Profits, instant Win)
ADA breakout (PERFECT targets, massive profits)
FET top warning (EXACTLY on time)
DASH top warning (EXACTLY on time)
Of course, I have had total FAILS on some ideas too, not going to pretend.
But all of my plots show PRECISE entries, TIGHT stops, and EXACT targets.
Precision is the way of the Fib. Almost every turn happens at a Fib Line.
.

ADA/BTC upcoming Resistance zones: Cardano bounce watchADA looks to have bottomed close to previous low.
The Impulse from previous low served as support.
Now approaching first resistance zone to watch.
Behavior at the resistance zones will be telling of strength.
Rejection from first Red zone again would be a very bad sign.
Break of first Red zone should be easy if bulls have any strength.
1155-1160 is the immediate but minor resistance
1213-1224 was previous rejection, need to break.
1341-1356 will be serious resistance to contend with.
.
See some of my other plots and trade calls below.
I also plot Forex and Stocks, take a look at my profile page .
Currently in Play:
FET battle of Impulses
BNB Re-Entry zones
MATIC Re-Entry zones
ZRX Break Out watch
NANO Impulse Redux
Recent Achievements:
NEO Rocket Launch (great entry, massive profits)
BTC path to 10k (in Progress, perfect turns)
BTC bottom 3.1k (caught the EXACT bottom)
ETH breakout (instant Profits, no drawdown)
MATIC rocket (massive Profits, breakout entry)
ZRX breakout (massive Profits, short wait)
XLM breakout (massive Profits, instant Win)
ADA breakout (PERFECT targets, massive profits)
FET top warning (Top warning JUST in time)
DASH top (Top warning EXACTLY in time)
Of course, I have had total FAILS on some ideas too, not going to pretend.
But all of my plots show PRECISE entries, TIGHT stops, and EXACT targets.
Precision is the way of the Fib. Almost every turn happens at a Fib Line.
.

ADA/BTC asking "to C or Not to C" ? Cardano ready to retrace?Cardano has been very strong since breakout.
But we really need a retrace to confirm supports.
Thus far we saw one leg pullbacks only, not 3 waves.
Currently at an important line: the Blue 2.618.
The 2.618 is often a strong support but was broken.
But even a once-broken 2.618 can form a "higher low".
Thus we can NOT be confident of Wave C happening.
.
This is an update to my ongoing anaylysis which started with aniticipated Breakout:
After the breakout, I had some near term targets which were hit and surpassed:
My last plot was expecting 1600 sats to be serious reistance, which proved correct:
Now watching closely for ABC to complete as normal, or to bounce off 2.618 and keep going:

ADA/BTC where is the fall going to STOP??ADA showing tremendous bearish results! As the 0.10$ barrier was broken, we cannot antecipate the bottom in a ADA/USD graph. So i'm using a ADA/BTC to see where we can expect ADA to find support. So the red rectangle, it is almost 100% sure it will touch that. If support isn't enought there, then we will have ADA where it was in October previous year, in the blue rectangle. As the whole market sinks, cardano has been probably the top10 one who has been seeing more decline. However previous experience has shown that most of currencies which have a bigger correction, are the ones with a higher increase after. Should we buy Cardano now?! i would wait a little longer to see what BTC will do.


ADA/BTC Cardano is begging you to BUYI believe ADA/BTC looks extremely attractive right now. I recently posted about ADA/ETH and while it is up slightly, ETH is way too bullish right now for Cardano to make a strong relative move.
In our first bull move (#1), we appreciated 33% and retraced to the 0.5 line.
Bull move #2: 19% appreciation, retrace to the 0.382 line.
Bull move #3: 11% appreciation
I believe the compression of these rises bodes very well for ADA/BTC and meanwhile, we have cupping action that makes me more confident in the bullish support. Strong resistance around 0.00003170 has been tested and few times and the sellers should be nearly washed out by now. I expect a break of this line and a sharp rise to at least 0.00003465.
Even if we break below the lower trendline, I will not be concerned. If we break below the previous structure low at roughly 0.00002870, I will begin to reconsider.
TP1: 0.00003465 (+12%)
TP1: 0.00003547 (+15%)
- Sultan of Chart
Published trade stats:
Wins: 2
Average gain: 8.5%
Losses: 0
Pending: 3 (including this idea)

ADA/BTC hit targets now what? Cardano retrace watch (15min chartADA hit the second target spotted in last analysis.
Now watching the retrace, looks be an ABC forming.
Two support zones are spotted that might end wave C.
1437 sats with the 3.618 fib would be strong bull bounce.
1400 sats with the 2.618 fib is the usual retrace area.
1387 sats with the 2.236 fib is a must hold for bulls.
This is an update to my ongoing analysis:
Staring with the expected breakout
Then looking for targets of the breakout
Last analysis was spotting the temporary top

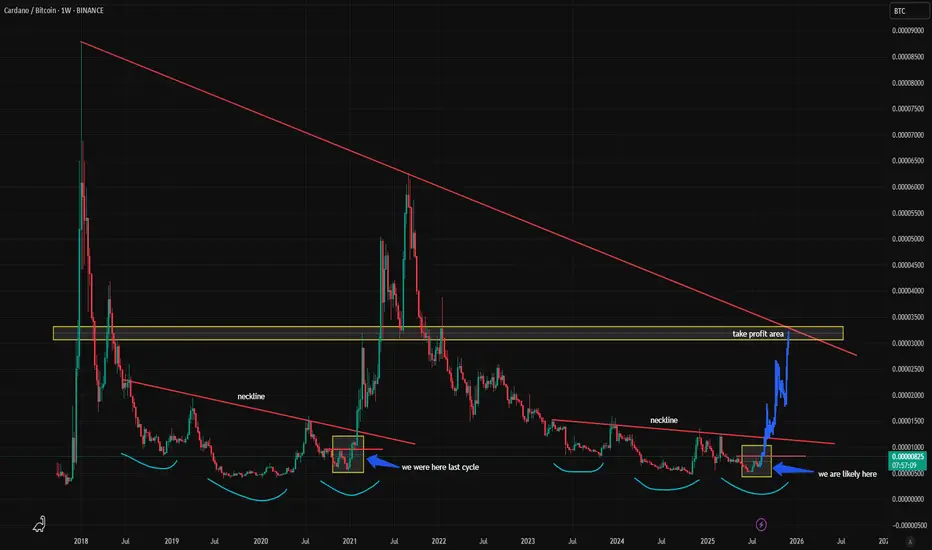
ADA/BTC - 2021 COMPARISONADA vs BTC from last cycle:
Inverse Head and Shoulders Pattern
Break of Local Resistance (red horizontal line)
Break of Neckline was the start of the bullrun for ADA/BTC
Current Cycle:
Possible Inverse Head and Shoulders Pattern
Awaiting Break of Local Resistance (red horizontal line)
Awaiting Break of Neckline to start the bullrun for ADA/BTC
We could see a pullback in September back to the bottom of the yellow box, making a swing failure pattern (September of post halving years have always been red), but if resistance breaks than it could signal the start of a huge breakout.
ADA to RISE - The rocket is turning it's engines on!ADA /BTC is at a key area right now. With all the positive news coming from CARDANO recently and the success of Haskell Testnet so far; things look very promising for the future and the rest of this year!
Plus, BTC failed to hold above the 10K resistance again. So we could easily see some profit-taking from BTC over the next few days.
We are looking for ADA to bounce off this lower trendline, push and then close above the upper trend line on the Daily time frame. This could then very well mean the bottom has been; and we will start to rise up never to return :P
A strong close on the Daily below the bottom trend line means we have been unsuccessful this time.
Overall the risk-reward looks good here.
Play it safe, don't over leverage and use a stop loss.
